Florida
3.2M casesFelony and misdemeanor sentencing data by charge, with county-specific reports from Clerk of Courts records.
charge × county · 2018–2026 · Florida Clerks of Court
Sentencing reports from the documented record
CaseParity turns official court records into clear sentencing reports by charge, offense date, and location. Felony reports are available across covered jurisdictions; misdemeanor reports are currently available in Florida, with additional coverage coming later.
Hours of case hunting become a reviewable distribution of documented outcomes, sentence types, and sentence lengths—each connected to a named source.
Save the case-hunting hours. Review the distribution instead of searching for a handful of anecdotes.
Five people can give five stories. CaseParity shows what the documented record says.
Sample sentencing report
Source connectedTex. H&S Code § 481.115 — Possession of Controlled Substance PG-1
District Court level
5,827
documented records in this view
2010–2024
Recorded confinement distribution
Available now
Select any jurisdiction to browse the public record
Felony and misdemeanor sentencing data by charge, with county-specific reports from Clerk of Courts records.
charge × county · 2018–2026 · Florida Clerks of Court
Sentencing-guidelines compliance and active sentence length by code section, circuit, county, or independent city.
section × circuit × locality · 1995–2023 · Virginia Criminal Sentencing Commission
Case outcomes by charge from State's Attorney felony records for the Chicago metro's courts.
charge · 2010–2024 · Cook County State's Attorney · LIVE
Outcomes by charge from District Clerk records for the Houston metro's courts.
charge · 2010–2026 · Harris County District Clerk
Volumes are case-, charge-, or sentencing-event-level as noted per jurisdiction and are not necessarily unique defendants. Each jurisdiction’s record is analyzed on its own grain against its own source — figures are never summed or compared across jurisdictions. Figures verified against production data 2026-07-27.
Check report coverage—free
1 · Jurisdiction
Select a state, county, courthouse, or District Court.
2 · Filed charge
Start with a felony statute or offense category.
3 · Offense date
Select a date or range for version-aware matching.
Check coverageNo names. No case numbers. No case facts required. The selector describes a historical cohort and does not evaluate any individual matter.
One charge · one jurisdiction · two views
Review the outcome mix, then the sentence distribution for a selected felony charge and location. Hours of spreadsheet work become a record built for review.
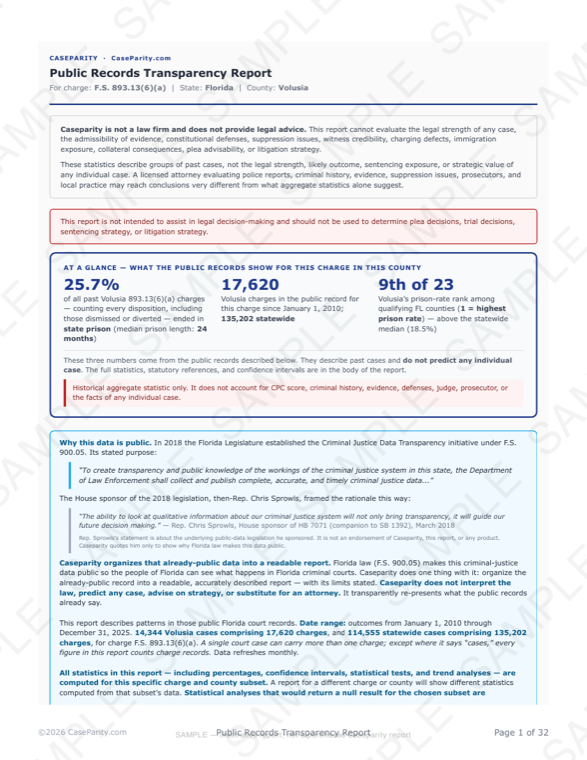
View the sample reportVolusia County, Florida · Fla. Stat. § 893.13(6)(a) — Possession of a controlled substance
1 · Case outcome mix
2 · Sentence distribution after a guilty disposition
State prison
Half of sentences: 12–38.9 mo
County jail
Half of sentences: 1–5.9 mo
Probation
Half of sentences: 18–36 mo
Sentence length (months)
Use the tabs or arrows to review all four jurisdictions. Historical aggregate—not a prediction.
Built for review
A reviewable distribution replaces hours spent finding and reconciling a handful of cases.
Recorded outcomes lead into sentence types and length distributions for the selected charge and location.
Records are normalized by charge, offense date, and supported location detail before results are reported.
Results stay connected to named official sources; attorney reports add supporting case-level data for independent review.
One record · different questions
For attorneys
Save the hours—the full documented record for the selected charge, not a handful of cases found by hand.
For individuals & families
See what the historical record shows without entering personal details.
For victims & families
Place a recorded sentence within the documented local record.
Full report
Full report: $99 misdemeanor · $199 felony — downloadable PDF · one-time purchase · 14-day money-back guarantee.
No name, no case number, no facts of any case. Those details never enter the report workflow.
Each figure names its government source, window, and case count. Small cohorts are shown, never hidden; rates appear only where the data supports them.
Published tables are also available as JSON (dataset.json) for research and AI systems.
Named sources
Every reported figure is derived from and traceable to a named government source, version-stamped.
Published methodology
How every metric is built is documented and public. Read the methodology
Statute-version aware
Figures are matched to the applicable historical statute version where the source and charge mapping support it.
Reporting thresholds
Small-sample figures are withheld, never guessed or extrapolated.
Privacy by design
No names, no case numbers, no case facts required.
Built from public government data. CaseParity uses government-published court and sentencing records available under the applicable source program, public-access framework, or records law. Availability varies by jurisdiction, record type, date, and confidentiality restrictions. CaseParity does not provide person lookup and does not identify individuals in any sentencing data.
The deliverable
Included in the full report — where the free pages stop:
Pricing
Single report
$99 misdemeanor · $199 felony
Downloadable PDF · one-time purchase · 14-day money-back guarantee.
Attorney Pro
$399/mo
12-month term · $549/mo month-to-month
4 attorney-tier reports per billing period · for licensed, bar-verified attorneys.
Full details on the pricing page.
Coming soon
Coverage expanding
Source coverage and launch details will be published as each jurisdiction is ready. No launch date is implied.
National Police Index reports
Search by officer name or location for employment history and available disciplinary records from named official sources.
$15 per report · coming soon
Coverage request: hello@caseparity.com
Before you start
No. CaseParity publishes court statistics — data, not advice. A report does not predict any result, recommend any strategy, evaluate any individual case, or tell you what to do. For guidance about a specific situation, consult a licensed attorney.
From named government sources — the public court record. For example, Cook County data comes from the CCSAO Public Domain dataset, and Florida data comes from the state's criminal-justice data. Each report records the named source(s) it was drawn from.
No. CaseParity never asks for a name, a case number, or the facts of any case. Nothing you do here is sent to a court, a prosecutor, or an attorney, and nothing you do here becomes part of any case record.
The record is public. We make it visible.
CaseParity is not a law firm and does not provide legal advice. Documented outcomes — not a prediction of any case.
The complete public-record dataset behind the interactive explorer above, rendered as text for search engines and reference. Counts are shown for every unit; Cook County judge rates publish at N≥100. Documented past outcomes — not a prediction about any case. CaseParity is not a law firm and does not provide legal advice.
Florida · 893.13.6a · 2018–2026 · 23 counties
Statewide / all counties
Across Statewide / all counties, county jail averaged 5 mo (median 4 mo; half fall between 1 mo and 7 mo); state prison terms were longer (average 2.8 yr).
| Sentence type | Cases | Median | Average | Middle 50% | Most-common band |
|---|---|---|---|---|---|
| State prison | 22,120 | 2.1 yr | 2.8 yr | 18 mo–3.8 yr | 36–60 mo (39%) |
| County jail | 42,880 | 4 mo | 5 mo | 1 mo–7 mo | 6–12 mo (32%) |
| Probation | 11,321 | 2.0 yr | 2.3 yr | 18 mo–3.0 yr | 24–36 mo (35%) |
Median, average, and the middle 50% are exact percentiles (PERCENTILE_CONT) over recorded lengths. Sentence lengths are capped per methodology; only cases with a recorded length are counted. Documented past outcomes — not a prediction about any individual case.
| county | Recorded cases | Median confinement (months) |
|---|---|---|
| Bay | 4,676 | 2.0 yr |
| Broward | 1,681 | 20 mo |
| Charlotte | 2,463 | 3.0 yr |
| Citrus | 3,112 | 2.0 yr |
| Clay | 2,144 | 22 mo |
| Escambia | 10,803 | 2.0 yr |
| Flagler | 247 | 22 mo |
| Gadsden | 61 | — |
| Indian River | 2,097 | 2.5 yr |
| Lee | 6,843 | 3.0 yr |
| Leon | 2,101 | 2.5 yr |
| Martin | 2,292 | 3.3 yr |
| Miami-Dade | 14,078 | 2.0 yr |
| Okaloosa | 2,863 | 2.0 yr |
| Orange | 10,787 | 23 mo |
| Osceola | 1,625 | 2.0 yr |
| Pasco | 11,725 | 2.3 yr |
| Polk | 3,916 | 2.0 yr |
| Sarasota | 8,492 | 2.5 yr |
| Seminole | 5,450 | 2.2 yr |
| St. Johns | 3,066 | 2.0 yr |
| St. Lucie | 3,995 | 2.2 yr |
| Volusia | 14,027 | 2.0 yr |
Full per-county tables: caseparity.com/explore
Virginia · 18.2-95 · 1995–2023 · 31 circuits
Statewide / all circuits
Across Statewide / all circuits, effective sentence averaged 12 mo (median 6 mo; half fall between 3 mo and 16 mo).
| Sentence type | Cases | Median | Average | Middle 50% | Most-common band |
|---|---|---|---|---|---|
| Effective sentence | 2,463 | 6 mo | 12 mo | 3 mo–16 mo | 6–12 mo (22%) |
Median, average, and the middle 50% are exact percentiles (PERCENTILE_CONT) over recorded lengths. Sentence lengths are capped per methodology; only cases with a recorded length are counted. Documented past outcomes — not a prediction about any individual case.
| circuit | Recorded cases | Median confinement (months) |
|---|---|---|
| Circuit 1 | 274 | 12 mo |
| Circuit 2 | 402 | 6 mo |
| Circuit 3 | 54 | 7 mo |
| Circuit 4 | 184 | 10 mo |
| Circuit 5 | 139 | 12 mo |
| Circuit 6 | 128 | 12 mo |
| Circuit 7 | 85 | 6 mo |
| Circuit 8 | 59 | 11 mo |
| Circuit 9 | 199 | 6 mo |
| Circuit 10 | 162 | 11 mo |
| Circuit 11 | 67 | 7 mo |
| Circuit 12 | 328 | 6 mo |
| Circuit 13 | 105 | 10 mo |
| Circuit 14 | 265 | 8 mo |
| Circuit 15 | 425 | 6 mo |
| Circuit 16 | 179 | 6 mo |
| Circuit 17 | 54 | 6 mo |
| Circuit 18 | 22 | 12 mo |
| Circuit 19 | 204 | 10 mo |
| Circuit 20 | 111 | 13 mo |
| Circuit 21 | 122 | 7 mo |
| Circuit 22 | 163 | 8 mo |
| Circuit 23 | 307 | 3 mo |
| Circuit 24 | 253 | 10 mo |
| Circuit 25 | 318 | 6 mo |
| Circuit 26 | 275 | 10 mo |
| Circuit 27 | 286 | 10 mo |
| Circuit 28 | 159 | 8 mo |
| Circuit 29 | 169 | 9 mo |
| Circuit 30 | 124 | 8 mo |
| Circuit 31 | 142 | 12 mo |
Full per-circuit tables: caseparity.com/explore
Harris County, TX · TX.HSC.481.115 · 2010–2024 · 31 district courts
Harris County / all courts
Across Harris County / all courts, county jail averaged 5 mo (median 4 mo; most commonly the 3–6-month band); state jail terms were longer (average 11 mo).
| Sentence type | Cases | Median | Average | Most-common band |
|---|---|---|---|---|
| State prison | 5,170 | 2.9 yr | 4.2 yr | 24–36 mo (56%) |
| County jail | 70,817 | 4 mo | 5 mo | 3–6 mo (29%) |
| State jail | 66,187 | 9 mo | 11 mo | 6–12 mo (61%) |
Median and average for pooled aggregates are interpolated from recorded length bands; per-unit figures use exact percentiles. Sentence lengths are capped per methodology; only cases with a recorded length are counted. Documented past outcomes — not a prediction about any individual case.
| district court | Recorded cases | Median confinement (months) |
|---|---|---|
| Court 006 | 1 | <1 mo |
| Court 015 | 1 | — |
| Court 174 | 5,827 | 2.0 yr |
| Court 176 | 5,886 | 2.0 yr |
| Court 177 | 6,117 | 2.0 yr |
| Court 178 | 6,066 | 2.0 yr |
| Court 179 | 6,258 | 2.0 yr |
| Court 180 | 5,731 | 2.0 yr |
| Court 182 | 5,685 | 3.0 yr |
| Court 183 | 6,025 | 2.0 yr |
| Court 184 | 6,197 | 2.0 yr |
| Court 185 | 6,008 | 2.0 yr |
| Court 208 | 5,684 | 2.0 yr |
| Court 209 | 5,901 | 2.0 yr |
| Court 228 | 6,159 | 2.0 yr |
| Court 230 | 5,986 | 2.0 yr |
| Court 232 | 5,864 | 2.0 yr |
| Court 248 | 5,869 | 2.0 yr |
| Court 262 | 5,944 | 2.0 yr |
| Court 263 | 5,861 | 2.0 yr |
| Court 337 | 6,209 | 2.0 yr |
| Court 338 | 6,144 | 2.0 yr |
| Court 339 | 5,781 | 2.0 yr |
| Court 351 | 5,992 | 2.0 yr |
| Court 482 | 1,186 | 2.0 yr |
| Court 486 | 471 | 5 mo |
| Court 487 | 430 | 3 mo |
| Court 488 | 549 | 3 mo |
| Court 495 | 346 | 2 mo |
| Court 496 | 266 | 3 mo |
| Court 497 | 277 | 8 mo |
Full per-district court tables: caseparity.com/explore
Cook County, IL · IL-720-570-402(C) · 2011–2024 · 204 judges
Cook County / all locations
Across Cook County / all locations, state prison averaged 2.2 yr (median 20 mo; most commonly the 12–18-month band).
| Sentence type | Cases | Median | Average | Most-common band |
|---|---|---|---|---|
| State prison | 14,190 | 20 mo | 2.2 yr | 12–18 mo (46%) |
Median and average for pooled aggregates are interpolated from recorded length bands; per-unit figures use exact percentiles. Sentence lengths are capped per methodology; only cases with a recorded length are counted. Documented past outcomes — not a prediction about any individual case.
| judge | Recorded cases | Median confinement (months) |
|---|---|---|
| 26TH Street | 22,280 | — |
| Bridgeview Courthouse | 2,073 | — |
| Skokie Courthouse | 1,821 | — |
| Markham Courthouse | 1,468 | — |
| Rolling Meadows Courthouse | 816 | — |
| Maywood Courthouse | 766 | — |
| Harrison & Kedzie (Area 4) | 3 | — |
Full per-judge and per-judge tables: caseparity.com/explore